by Mary Orr, MsC Biology, Researcher/Hobbyist

It is easy to assume that the results you obtain from an aquarium water test kit are the answer to the question "What is the level of this substance in my tank?" The value you get when you conduct any test, however, is almost never the true level. This is because all measurements are subject to some degree of error. The degree of error is influenced by many variables and can range greatly. To give an example of how this error occurs and how it must be considered when interpreting results, we will examine the testing of calcium levels in the marine aquarium.
Calcium testing methods for saltwater range from complicated, expensive ion chromatography and ICP/MS (inductively coupled plasma mass spectroscopy) to simple drop titration methods. All methods, even the most sophisticated, are subject to a number of sources of error and these individual sources of error can add up to significant differences in values obtained. The most sophisticated methods applied with poor technique will give no better results than simpler methods carefully applied.
Potential sources of error include:
- Sample concentration errors, including errors in measuring of salt and water and errors in measuring salinity.
- Dilution errors when samples must be diluted into the range of the instrument or method, including errors introduced when the dilution water is not of high purity.
- Calibration errors.
- Errors due to technique.
- Errors due to aging or contaminated reagents.
- Errors in calculations.
In addition, the sensitivity of the test method must be considered.
Each of these errors can be considered in detail to get an idea of the accuracy that can be expected of a particular measurement method. By far the most common test method used by hobbyists is titration. It is a simple, reliable and reasonably accurate method, but the potential for error and the inherent accuracy of the test method must be considered when interpreting results. Some examples can illustrate the accuracy that may be expected of these types of tests.
Example 1
Joe uses a bottle dropper type titration test kit to measure the calcium level in his aquarium. The actual (true) calcium level is 400 ppm. He carefully measures a vial full of the water to be tested, adds the correct reagents in the correct order and mixes them properly. He titrates with the dropper bottle, carefully counting the drops, but he does not realize that the drop size varies considerably depending on whether the bottle is held vertically or at an angle to vertical. He titrates with the bottle at an angle and each drop contains about 0.48 grams (with some variability). If the same bottle is used held vertically the drop size is very consistently 0.38 to 0.39 grams. If the bottle is held correctly 27 drops are required before the color changes. Joe sees a color change in 22 drops. Based on this number of drops, he calculates his calcium to be 330 ppm.
Example 2
Laura uses a syringe-type titration test kit to measure the calcium level in her aquarium. The actual (true) calcium level is 400 ppm. She follows all directions carefully but does not see that there is air in the tip of the titrant syringe because she inadvertently pulled the syringe out of the titrant as she was pulling up the last of the titrant. Because the air is in the narrow tip it is difficult to see. This small amount of air displaces 0.05 ml of the titrant, leading to a reading 25 ppm lower than true calcium level. If Laura had also stopped the titration when the solution had turned from pink to purple, rather than titrating to reach the true blue indicating full reaction, she would have a reading that is another 20 ppm lower, giving a final reading of 355 ppm.
Example 3
David starts a new aquarium by mixing a synthetic sea salt in his aquarium. The manufacturer claims a calcium concentration of at least 400 ppm at 34 ppt salinity. David fills his 40 gallon aquarium with RO water and adds the amount of synthetic salt specified to make 40 gallons. He then measures the calcium level to see if it meets the manufacturer's claim; the measurement reads 365 ppt. David has not yet checked his salinity. If he had, he would have found that it was 31 ppt. This has happened because the actual volume of water in the aquarium and other reservoirs was 43.5 gallons (aquarium volumes are not precise and the volume of water in large hang-on filters, canister filters and sumps will add to the total water volume). If David had checked his salinity, but there was an error in the salinity measurement device of +/- 1 ppt, he would also have an inaccurate calcium reading by about 11 ppm.
The Table illustrates the pronounced effects of salinity on calcium concentrations in sea water.
| Specific
Gravity
(15/4 scale) |
Natural Seawater* |
| (salinity in ppt) |
Calcium |
Magnesium |
| 1.019 (25.9) |
305 |
950 |
| 1.02 (27.2) |
320 |
998 |
| 1.021 (28.5) |
335 |
1046 |
| 1.022 (29.8) |
351 |
1093 |
| 1.023 (31.1) |
366 |
1141 |
| 1.024 (32.4) |
381 |
1187 |
| 1.025 (33.7) |
397 |
1236 |
| 1.026 (35) |
412 |
1284 |
* Data for seawater values taken from An Introduction to the Chemistry of the Sea. 1998. M.E.Q. Pilson
|
These examples illustrate how easy it can be to make small errors that greatly affect test results. While this degree of error may be frustrating to the hobbyist, it must be kept in mind that even sophisticated methods are subject to error. An examination of the literature shows that even expensive methods conducted in professional laboratories can result in fairly large errors. One calcium containing sample was analyzed by 44 laboratories using the EDTA titration method. The relative standard deviation was 9.2%. ICP/MS methods give relative standard deviations in the 5-10% range, depending on the element.
So How Do You Deal with The Potential for Error?
It is very important to understand how multiple small errors can compound to give highly erroneous readings. The examples cited show the results of single or multiple errors.
Common errors include:
- Salinity determination and calculation errors.
- Technique errors.
- Equipment or reagent (chemical) problems.
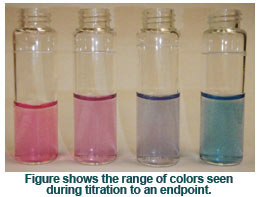
- Endpoint color interpretation.
The following steps can help to minimize errors:
- Read and carefully follow all instructions for the test kit you use. Check the age and expiration dates of reagents.
- Be sure you know the salinity of the sample you are testing. To get an accurate sample, mix and aerate the solution well, preferably for 24 hours. Be sure a refractometer is temperature calibrated or be sure a hydrometer is free of bubbles and on a level surface. If the value you get seems unusual or if you have doubts about the accuracy, double check your calculations and review test instructions. If no problems are found, repeat the test one or more times to determine if your results are consistent.
- Keep in mind that the value you get, no matter what the test method, is a "more or less" value. Fortunately, while many test kits and references give a single "best" value for a water parameter, rarely is an exact value required for a healthy aquarium. It is far less frustrating to work to keep your aquarium in a healthy range around a desirable average than to fight to keep it at a specific value. For example, if you wish to keep your calcium level at an average of 400 ppm, you can keep the calcium readings in the 360 to 440 ppm range, with the goal of averaging around 400 ppm over time, without worrying about normal test error.
|